
How to analyze work-center capacity and load
Capacity-load analysis compares the load created by selected order operations with calendar capacity at the same resource level, time bucket, and unit. Negative remaining capacity shows an overload under the current scope. A planner still needs to trace it to the relevant orders and operations, reconcile the data, and review response options.
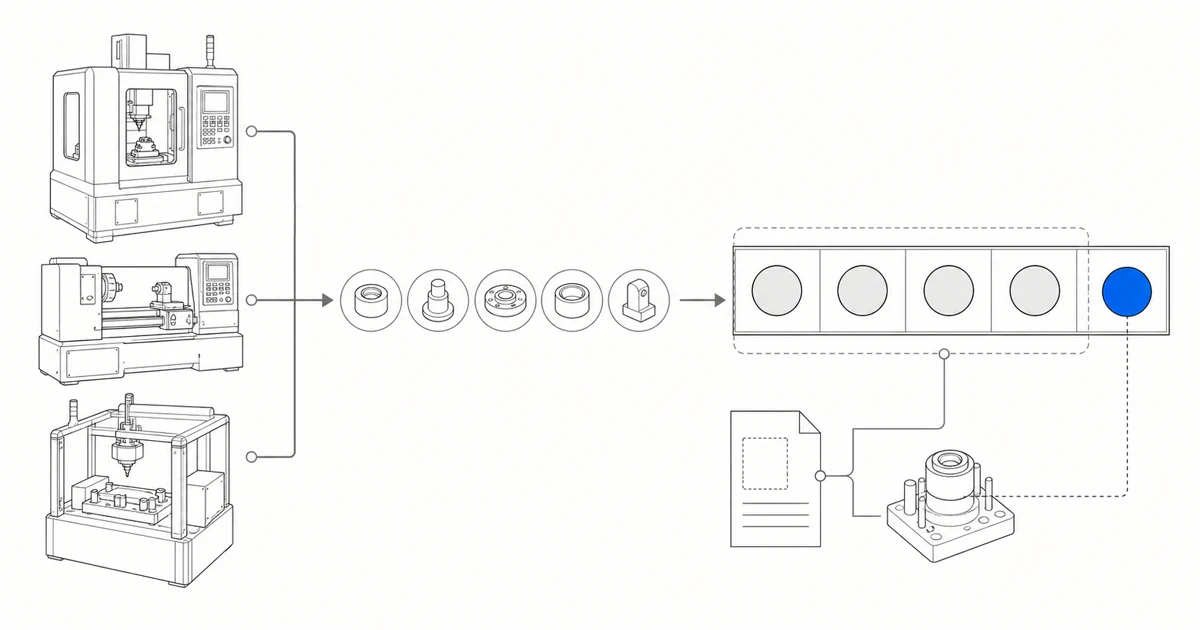
Align the scope, period, and unit
Start with the decision the load view needs to support. The team may be checking whether one work center can carry next week's existing orders, locating overload before month end, or deciding whether a new order should enter detailed scheduling. Fix the resource scope, analysis horizon, data cutoff, plant time zone, and review owner.
Resource level matters. A work center may aggregate several machines or labor groups that are not fully interchangeable. Official Microsoft and Oracle documentation shows how work-center totals and individual resources can diverge. Aggregate headroom does not establish that every eligible machine has an open slot.
The time bucket and unit need the same discipline. Daily, weekly, and shift-level load expose different problems, while machine hours, labor hours, pieces, and weight cannot be added without a defined conversion. Preserve the source and effective date of any conversion from units or weight to standard time.
Calculate available capacity from the calendar
Available capacity begins with the resource calendar. Working days, shifts, breaks, holidays, maintenance, downtime, absences, and temporary exceptions all change the time available in a bucket. An unconfigured working day can also appear as zero capacity in a planning product, so a fixed eight-hour assumption is not a substitute for the calendar.
Parallel resource units, utilization settings, and efficiency settings can change available capacity or scheduled duration. Microsoft and Oracle document different ways these parameters affect capacity or scheduled duration. An analysis should expose the parameters it uses instead of transferring one vendor's efficiency or utilization formula to another system.
Calendar capacity remains a model input rather than a live machine state. Keep the calendar version, exception source, and last successful refresh with the result. When a temporary outage or absence has not entered the data, mark it as an unknown instead of letting modeled headroom hide a shop-floor change.
Calculate load from order operations
Load comes from the order operations included in the review. Define which planned, firm-planned, released, and started work enters the calculation, then aggregate setup time, run time, remaining quantity, and target resource through the applicable routing. Microsoft Business Central provides one documented status and time convention; other systems need their own inclusion rules checked.
Route version, operation precedence, eligible resources, and standard times determine where load lands. A quantity change, alternate routing, or different resource can all change the capacity requirement. The treatment of waiting, transfer, and subcontracting time also needs to be stated before the first calculation.
Reported progress is a common source of distortion. Completed work that remains in the requirement can create a false overload, while consumed time that has not been reported can create false headroom. Missing progress, time, or resource mapping belongs on an exception list and should not be silently replaced with zero.
Compare load, capacity, and remaining capacity
Keep every number at the same resource, bucket, and unit. This page uses available capacity for calendar capacity before order load is deducted and remaining capacity for the resulting balance. Available capacity minus order load gives remaining capacity, while order load divided by available capacity gives planned load ratio. Some products use available capacity for the post-load balance, so verify the field definition in the source system. If available capacity is zero, show that condition directly rather than hiding the denominator in a normal percentage.
Negative remaining capacity means the resource and period are overloaded within the stated scope. It is a drill-down signal, not a confirmed late order. Positive remaining capacity only shows aggregate headroom. It does not establish that a specific operation can satisfy precedence, material timing, and resource eligibility.
Each manufacturer sets load thresholds for the resource, buffer, and planning objective. There is no universal healthy percentage. Planned load ratio is also different from actual equipment utilization. Actual equipment utilization requires equipment-state and cycle-time data. Overall equipment effectiveness additionally requires uptime, performance, and quality data.
- Available capacity
- Effective capacity for the same resource and bucket, based on calendars, shifts, exceptions, resource units, and declared parameters.
- Order load
- Setup, run, and other declared capacity requirements from included order operations in the same unit.
- Remaining capacity
- Available capacity minus order load. A negative value flags overload; a positive value shows only aggregate headroom.
- Planned load ratio
- Order load divided by available capacity, shown with its numerator, denominator, resource, bucket, and rule.
Trace overloads to orders and operations
An overload first identifies a resource and period that need investigation. Expand the value into its production order, operation, status, setup and run times, scheduled start and end, remaining work, and protected state. Microsoft task lists and SAP capacity pages show product-specific ways to move from resource load to order-operation detail.
Reconcile the basis before treating the overload as a planning problem. Duplicate orders, obsolete routings, incorrect resources, unrelieved reported work, stale calendars, and unit conversions can turn a data error into an apparent bottleneck. A work-center total also needs to be checked against the machines, people, or tools that are actually eligible.
Even a reconciled overload is a candidate bottleneck. It may reflect concentrated due dates, setup, downtime, protected work, or the way one routing assigns demand. The load view narrows the investigation. Order detail, routing relationships, and shop-floor facts are still needed to confirm causes and affected work.
Test response options on one snapshot
After reconciling the overload, build response candidates separately. Options may move work, use an eligible alternate resource, split quantity, change sequence, apply an authorized shift change, or consider subcontracting. Extra shift capacity belongs in a candidate only after it has been authorized and added to the applicable calendar.
Use the same order set, cutoff, and baseline for each candidate, and change one disclosed policy or condition at a time. Then list changes to the dates, resources, sequence, and risk of existing orders. If the orders, calendar, routing, and rules all move together, the team cannot explain why the result changed.
Every response creates a tradeoff. Moving one order out of an overloaded bucket can consume capacity elsewhere, add a changeover, or delay another commitment. Software can organize candidates and affected orders, while the manufacturer's authorized people decide whether overtime, subcontracting, splitting, or a customer-date change is allowed.
Separate a load view from detailed scheduling
Daily or weekly load locates resource pressure without finding an exact start time for every operation. Microsoft production documentation separates coarser operations scheduling from job scheduling with specific dates, times, and resources. Product terms differ, but the distinction in analysis detail remains.
A weekly bucket can show headroom while no continuous slot remains on Monday morning. Operation precedence, specific resources, material availability, changeovers, protected work, and other orders all affect placement. Detailed finite-capacity scheduling must continue checking those conditions rather than treating aggregate headroom as proof that an order fits.
The useful output of load analysis is a reviewable set of pressured resources, overloaded periods, order-operation detail, data gaps, and response candidates. It focuses the detailed-scheduling review rather than replacing its result. The finite-capacity guide explains how operations are placed on constrained resources.
Keep planner confirmation and data boundaries
Every result should show its data cutoff, time zone, order scope, calendar version, routing version, refresh status, defaults, and omissions. Planners need to know which point in time the view represents, which shop-floor facts are present, and which still require manual reconciliation. Do not call the view real-time without a verified refresh mechanism.
Oracle separates refresh, solve, review, adjustment, and release in its production-scheduling workflow, showing how a candidate can remain distinct from production records. These are product-specific actions. They do not establish one status model for every APS product or prove that Kavop has the same write-back behavior.
Kavop can currently read ERP exports, spreadsheets, SQL data, the current schedule, and operating rules, generate comparable candidates, and explain late orders, bottlenecks, and rush-order impact within the represented scope. The first round stays read-only while planners review the load basis, candidates, and remaining risk. Kavop supports export, while controlled release remains limited in scope and does not automatically write back to ERP or MES.
Sources
This guide draws on official Microsoft, SAP, Oracle, and NIST material. Third-party product documentation describes objects and behavior in the stated versions. It does not imply endorsement of Kavop or establish that Kavop implements equivalent features.
- Microsoft Learn View Load on Work and Machine Centers
- Microsoft Learn Set Up Work Centers and Machine Centers
- Microsoft Learn Set Up Shop Calendars
- Microsoft Learn Finite Capacity Planning and Scheduling
- Microsoft Learn Production Process Overview
- Microsoft Learn Routes and Operations
- SAP S/4HANA 2025 FPS01 Project System Capacity Data in the Work Center
- SAP Work Center Capacity per Bucket API
- SAP S/4HANA 2025 FPS01 Manage Work Center Capacity
- SAP S/4HANA 2025 FPS01 Planning Table in Tabular Form
- Oracle Fusion Cloud SCM 26B Assign Resources to a Work Center
- Oracle Fusion Cloud SCM 26A Utilization and Efficiency Impact on Scheduling
- Oracle Fusion Cloud SCM 26B Resource Utilization Chart
- Oracle Fusion Cloud SCM 26A Supplier and Capacity Constraints
- Oracle Fusion Cloud SCM 26B Production Scheduling Tasks and Business Flows
- NIST AMS 300-11 Recommendations for Manufacturing Data
Use one pressured work center and one order set to reconcile the load numbers.
The first review uses read-only data at a fixed cutoff. Planners reconcile capacity, load, and overload detail before deciding which candidates should enter detailed scheduling. Findings from one sample cannot be extrapolated to the whole plant.